Does Winning the Toss Matter in IPL? TeamStats Analysis of 1,243 Matches

Does Winning the Toss Matter in IPL? TeamStats Analysis of 1,243 Matches
Winning the toss is one of the first major talking points before almost every IPL match. Pitch conditions are discussed, dew is analysed and captains are immediately asked why they decided to bat or field.
But across the history of the Indian Premier League, how much has winning the toss actually mattered?
TeamStats.in analysed 1,243 IPL match records covering the competition from 2008 through the end of the 2026 season.
After excluding nine matches that produced no result, the final research sample contained 1,243 decided IPL matches.
The result was much closer than the attention given to the toss might suggest.
Toss-winning teams won 634 of those 1,243 matches — a success rate of 51.38%.
That means the toss winner finished only 34 victories ahead of the toss loser across the entire 19-season sample.
The deeper data, however, reveals something more interesting: what captains did after winning the toss appears to have been associated with a much larger difference than simply winning it.
TeamStats Original Research: IPL Toss Study
| Research Metric | Result |
|---|---|
| IPL match files analysed | 1,243 |
| Decided matches included | 1,243 |
| No-results excluded | 9 |
| Toss winner also won match | 634 |
| Toss winner lost match | 600 |
| Overall toss-winner success | 51.38% |
| Toss winners choosing to field | 820 |
| Field-first toss winners who won | 446 |
| Field-first success rate | 54.39% |
| Toss winners choosing to bat | 414 |
| Bat-first toss winners who won | 188 |
| Bat-first success rate | 45.41% |
For readers looking beyond this study, TeamStats maintains a broader IPL Stats section covering records and statistical trends across the competition.
The Main Finding: Winning the Toss Barely Moved the Overall Result
Across the 1,243 decided matches:
Toss winner won: 634
Toss loser won: 600
That produces:
Toss-winner success rate: 51.38%
A completely even distribution would be 50%.
The historical IPL result sits only 1.38 percentage points above that level.
This does not mean the toss is irrelevant. Conditions on a particular night can make the decision extremely important.
What the long-term data does show is that winning the toss alone has not been a strong predictor of the eventual IPL match winner.
Choosing to Field Produced a Very Different Result
The analysis becomes more interesting when the toss decision is included.
Toss-winning captains chose to field first in 820 decided matches.
Those teams won 446 times.
That equals a:
54.39% win rate
Toss winners chose to bat first in 414 matches and won only 188.
That equals:
45.41%
| Decision After Winning Toss | Matches | Wins | Win Rate |
|---|---|---|---|
| Field first | 820 | 446 | 54.39% |
| Bat first | 414 | 188 | 45.41% |
The difference between the two groups is almost nine percentage points.
TeamStats Chart: Field First vs Bat First
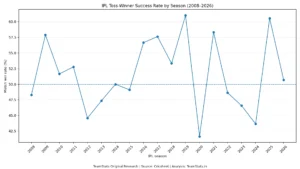
TeamStats Original Research: Toss winners choosing to field won 54.39% of their matches, compared with 45.41% when choosing to bat.
This is a much stronger historical difference than the overall toss-win figure.
However, it should not be interpreted as proof that choosing to field causes teams to win more often.
Captains choose based on conditions rather than randomly. Dew, pitch behaviour, venue, weather, team composition and opposition strength can influence both the toss decision and the match result.
The finding therefore shows an association, not automatic causation.
IPL Toss Winner Success Rate by Season
The all-time 51.38% figure also hides enormous season-to-season variation.
| IPL Season | Decided Matches | Toss Winner Won | Win Rate |
|---|---|---|---|
| 2008 | 58 | 28 | 48.28% |
| 2009 | 57 | 33 | 57.89% |
| 2010 | 60 | 31 | 51.67% |
| 2011 | 72 | 38 | 52.78% |
| 2012 | 74 | 33 | 44.59% |
| 2013 | 76 | 36 | 47.37% |
| 2014 | 60 | 30 | 50.00% |
| 2015 | 57 | 28 | 49.12% |
| 2016 | 60 | 34 | 56.67% |
| 2017 | 59 | 34 | 57.63% |
| 2018 | 60 | 32 | 53.33% |
| 2019 | 59 | 36 | 61.02% |
| 2020 | 60 | 25 | 41.67% |
| 2021 | 60 | 35 | 58.33% |
| 2022 | 74 | 36 | 48.65% |
| 2023 | 73 | 34 | 46.58% |
| 2024 | 71 | 31 | 43.66% |
| 2025 | 71 | 43 | 60.56% |
| 2026 | 73 | 37 | 50.68% |
A table gives the exact numbers, but the trend becomes much clearer when all 19 seasons are visualised together.
TeamStats Chart: Toss-Winner Success by IPL Season
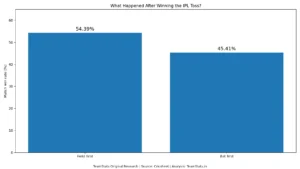
Season-by-season TeamStats analysis showing how frequently the toss winner also won the IPL match from 2008 through 2026.
The line does not move steadily upward or downward.
Instead, it fluctuates sharply.
That is important because it suggests there is no single toss effect that remains constant across IPL history.
2019 Was the Strongest Season for Toss Winners
Among the seasons analysed, IPL 2019 produced the highest toss-winner success rate.
Toss winners won:
36 of 59 decided matches
That equals:
61.02%
IPL 2025 came close at 60.56%, with toss winners winning 43 of 71 decided matches.
Those seasons demonstrate that the toss can be associated with a meaningful advantage during a particular tournament.
But the very next comparison shows why the long-term picture matters.
IPL 2020 Was Almost the Exact Opposite
In IPL 2020, toss winners won only:
25 of 60 matches
That is:
41.67%
Teams losing the toss therefore won 35 of the 60 decided matches.
Compare the two consecutive seasons:
2019 — 61.02%
2020 — 41.67%
That is a swing of more than 19 percentage points.
If winning the toss created a consistent major advantage, such dramatic reversals would be much harder to explain.
Instead, the data suggests that season-specific conditions matter considerably.
For more historical IPL numbers beyond the toss, readers can explore the Cricket Stats & Records hub.
Has the Toss Become More Important in Modern IPL?
To investigate whether the importance of the toss has changed over time, TeamStats divided the competition into three broad eras.
| IPL Era | Decided Matches | Toss-Winner Wins | Win Rate |
|---|---|---|---|
| 2008–2013 | 397 | 199 | 50.13% |
| 2014–2019 | 355 | 194 | 54.65% |
| 2020–2026 | 482 | 241 | 50.00% |
The middle period stands out.
From 2014 through 2019, toss winners won 54.65% of decided matches.
But that advantage did not continue into the most recent seven-season period.
TeamStats Chart: Toss Impact Across Three IPL Eras
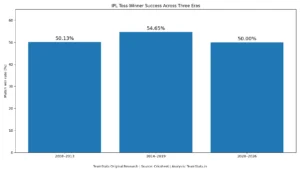
TeamStats comparison of toss-winner match success across three periods of IPL history.
The first era sits almost exactly around 50%.
The middle era rises.
Then the 2020–2026 period returns to precisely 50%.
That produces one of the strongest findings in this research.
From 2020 to 2026, the IPL Toss Record Was Exactly 241–241
Across the seven IPL seasons from 2020 through 2026, there were 482 decided matches in our sample.
The result:
Toss winners won 241
Toss losers won 241
That is an exact:
50.00% vs 50.00% split
This finding challenges the idea that the toss has automatically become more decisive in modern IPL cricket.
Modern T20 discussion frequently focuses on dew, chasing and evening conditions. Those factors can certainly matter in individual matches.
But across this seven-season sample, simply winning the toss provided no aggregate win advantage at all.
What About IPL Playoffs?
Knockout matches create a different pressure environment, so TeamStats also separated playoff results.
The dataset contained 74 decided playoff matches.
Toss winners won:
41 of 74
That equals:
55.41%
For comparison, the toss-winner success rate during league-stage matches was:
51.12%
| Match Type | Toss-Winner Success |
|---|---|
| IPL playoffs | 55.41% |
| League stage | 51.12% |
| All decided matches | 51.38% |
The playoff number is interesting, but it needs careful interpretation.
Seventy-four matches are a much smaller sample than the league-stage dataset. Therefore, this research does not conclude that winning the toss inherently provides a stronger playoff advantage.
It simply records that historically, toss winners have won a somewhat higher share of the playoff matches in this dataset.
Individual knockout rivalries can behave very differently. TeamStats’ GT vs RR playoff record, for example, looks specifically at one matchup rather than drawing conclusions from the entire competition.
Five Things We Learned From 1,243 IPL Matches
1. Winning the toss alone has provided only a small advantage
Across all decided matches:
51.38% toss-winner success
That is remarkably close to an even split.
2. Fielding first after winning the toss produced better historical results
The difference was substantial:
Field first — 54.39%
Bat first — 45.41%
The result deserves further investigation by venue and season.
3. Toss impact varies dramatically from season to season
The highest season in the study reached:
61.02% — 2019
The lowest fell to:
41.67% — 2020
This variation is too large to ignore.
4. Recent IPL history is perfectly balanced
Across 2020–2026:
241 toss-winner victories
241 toss-loser victories
No aggregate advantage.
5. Playoff results show a stronger association, but the sample is small
Playoff toss winners recorded a:
55.41% success rate
Interesting—but not sufficient on its own to establish a causal playoff advantage.
Why This Does Not Mean Captains Should Always Field First
The 54.39% field-first figure is tempting to interpret as tactical proof.
That would go beyond what the data actually establishes.
Imagine two matches.
In one, heavy evening dew is expected. The captain wins the toss and fields.
In another, the pitch is expected to deteriorate sharply. The captain wins the toss and bats.
Those decisions are responding to completely different environments.
Therefore:
Toss decision → conditions → team strength → match result
are interconnected.
A more advanced study would need to control for factors including venue, season, opposition strength and potentially playing conditions.
That is also why TeamStats will treat this research as the beginning of a series rather than the final word on IPL toss strategy.
What TeamStats Will Analyse Next
This dataset opens several deeper questions.
Does fielding first work better at some IPL stadiums than others?
How much does home advantage matter?
Has chasing 200+ become significantly easier?
Which grounds have historically produced the largest gap between batting-first and chasing results?
These questions can be analysed using the same match-level dataset rather than relying on isolated examples.
Future studies will be added to the TeamStats IPL Stats and Cricket Stats & Records sections as the research series develops.
TeamStats Research Methodology
This study was independently calculated by TeamStats.in using IPL match records supplied in Cricsheet’s JSON format.
The downloaded dataset contained:
1,243 IPL match files
covering IPL seasons from:
2008 through 2026
For the primary analysis:
- Every IPL JSON match record was loaded.
- Matches recorded without a final result were excluded.
- Matches with a decided winner were retained.
- Tied matches resolved through an eliminator/Super Over were assigned to the recorded eliminator winner.
- The toss winner was compared with the final match winner.
- Results were grouped by season and toss decision.
- IPL stages were separated for league/playoff comparisons.
- Percentages were independently calculated by TeamStats.in.
The final primary sample contained:
1,243 decided matches
Why venue analysis is not included yet
Historical venue names are not completely standardized.
For example, the same ground can appear under different naming formats across seasons.
Combining venue records without first normalizing those names could produce misleading results.
For that reason, venue-level toss findings have deliberately been excluded from this edition.
They will be analysed separately after venue normalization.
Data Source
Primary dataset: Cricsheet IPL match data in JSON format.
Cricsheet provides structured cricket match data, while the calculations, groupings, comparisons, charts and interpretations in this article were independently produced by TeamStats.in.
Research period: IPL 2008–2026
Match files analysed: 1,243
Decided matches analysed: 1,243
No-results excluded: 9
Analysis: TeamStats.in
Last updated: September 2026
Frequently Asked Questions
What percentage of IPL matches are won by the toss winner?
In TeamStats’ analysis of 1,243 decided IPL matches from 2008–2026, teams winning the toss also won the match 51.38% of the time.
How many IPL matches were analysed?
The source dataset contained 1,243 IPL match files. After nine no-results were excluded, 1,243 decided matches remained.
Is batting or bowling first better after winning the IPL toss?
Historically in this dataset, toss winners choosing to field won 54.39% of their matches. Toss winners choosing to bat won 45.41%.
The figures show historical association rather than proof that the toss decision caused the result.
Which IPL season had the strongest record for toss winners?
IPL 2019 produced the highest toss-winner success rate in this analysis at 61.02%.
Which season had the lowest toss-winner win rate?
IPL 2020 was lowest at 41.67%.
Does winning the toss matter more in IPL playoffs?
Toss winners won 55.41% of the 74 decided playoff matches in the dataset, compared with 51.12% during league-stage matches. Because the playoff sample is much smaller, the difference should be interpreted cautiously.
Has the toss become more important recently?
Not on an aggregate basis.
Across IPL 2020–2026, toss winners and toss losers each won exactly 241 of 482 decided matches.
Final TeamStats Finding
After examining 1,243 decided IPL matches across 19 seasons, the strongest conclusion is not that the toss does not matter.
It is that its importance is highly dependent on context.
Across the full period:
Toss winners — 634 victories
Toss losers — 600 victories
That leaves the toss winner with a modest 51.38% overall success rate.
The decision data is more striking. Toss winners choosing to field recorded a 54.39% success rate, compared with 45.41% for those choosing to bat.
Yet even that relationship changed considerably across seasons.
And perhaps the clearest warning against overestimating the toss comes from recent IPL history:
2020–2026
Toss winners: 241 wins
Toss losers: 241 wins
After nearly two decades of IPL cricket, the data suggests that the toss can influence the conditions in which a match is played.
It has not reliably determined who wins it.
TeamStats Original Research — calculations and charts by TeamStats.in using Cricsheet IPL match data.
Source- Cricsheet IPL data

Related Posts
RCB vs GT Winning Percentage: Complete IPL Win Record
Rachin Ravindra Stats: Runs, Centuries, Wickets, Test, ODI, T20I & IPL Records
Virat Kohli Stats: Runs, Centuries, Records, ODI, Test, T20I & IPL
GT vs RR Playoff Record: IPL Final & Knockout Match History
RR vs GT at Sawai Mansingh Stadium: Head-to-Head, Stats & IPL Record